
 * Click on pictures for a larger view.
 For those of you who haven't been following the heated discussion after Jay posted his report on OVEN, take a look at http://mcgillinvestmentclub.blogspot.com/2006/03/anonymous-comment-on-oven.html"
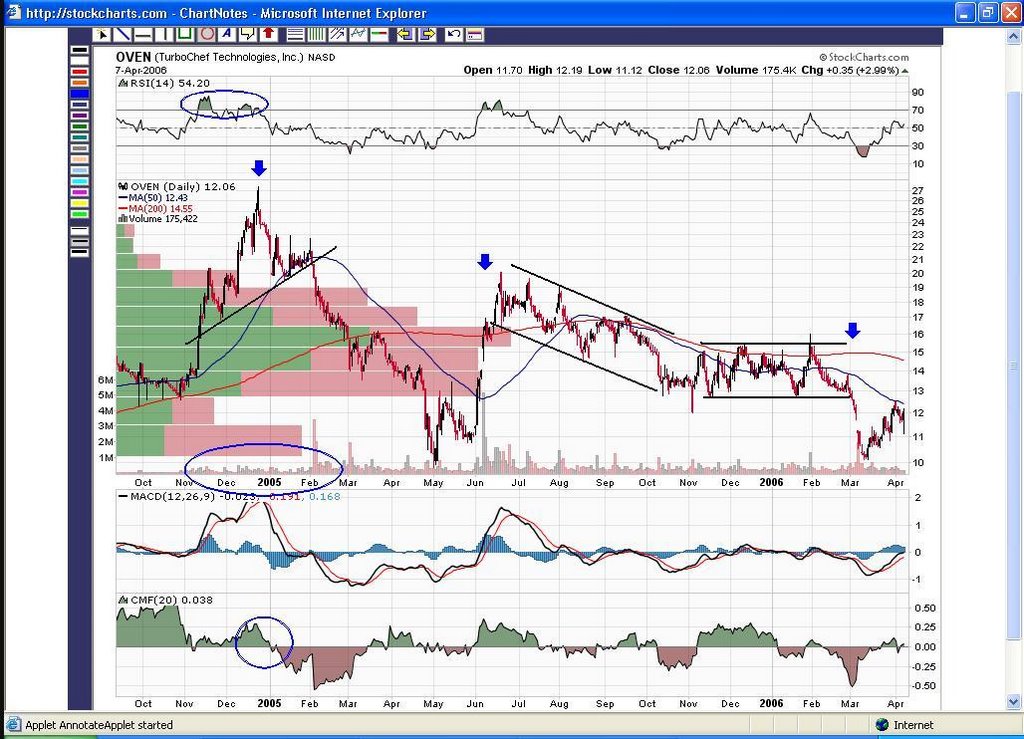
Alright, I've posted two charts, I'll be talking mainly about the first one, but take a look at the second chart to see some major events (splits, earnings, etc) .
First off take a look at the all time chart http://finance.yahoo.com/q/bc?s=OVEN&t=my.
Notice that despite the runup through the first half of 1997, the long term has been bearish.
The Subway deal saved the stock and a major runup is followed starting roughly november 2003.
Alright, focusing exclusively on the past two years (follow the first chart) you can see the fast run starting early novermber and topping late december, notice the weak volume support, especially after hitting the top, now the second weak runup has formed a classic technical favorite pattern of head and shoulders, after which the stock has broken the neckline on very heavy volume. I can't quite figure out what caused this (fundamentally), but a 1:3 stock split was declared right before the fall and then it's all downhill.
Fast forwarding to June 2005, Jim Cramer comments and much promised speculations for a deal with starbucks or a second deal with subway caused an extreme fast run on heavy volume (greed + short covering + triggering stop buys) , but notice the strong resistance on $20, which is the right shoulder on head-and-shoulder pattern. Quite obvious at this point.
Notice the triple top formation with nice volume supports from mid June to mid August, each top lower than the other and declining volume. Even without trendlines the move is obviously bearish.
The most relevant part right now is the extensive trading range of November - March right before the earnings disappoitment. Also notice the bearish move before the announcement.
After the fall the movement has been quite bullish, which could very well be shorts covering their positions. Also as Jay said, short ratios are published about biweekly (depending on the exchange) and if someone shorted and covered within that period it wouldn't show up. Take a look: http://www.shortsqueeze.com/index.php?symbol=oven Average days to cover is roughly 18 days.
I looked up the insider roster, didn't really see any insiders buying the stock. Keep in a mind that an option exercise doesn't count. The only thing I care about is an insider buying with cold hard cash, and lots of it. So if some insider's salary is 200k and he's buying 150k stock of his own company, then I consider that significant.
I don't think the stock is going anywhere and is likely to stagnate; however, there should be quite a good buildup of stopbuys around 13, but the large positions stopbuys are between 15-16. Breaking north of 13 could easily generate enough push to trigger those higher ones. This is not something that I'd like to bet on as odds are not favorable at this point, but if the move happens then you can be sure that I thinks odds are that the breakout would easily reach 16 and you would have some time to get on the train provided you act fast. The volume by price chart speaks for itself, you can see that $13-$16 trading range is where most of the action has happened, and in near future these are the strongest supports/resistance.
From a fundamental point of view, I have to say it doesn't seem much prospect for the stock. I wouldn't say anything much more, cause it's nicely put in Jay's report.
posted by Kaveh at
4/10/2006 02:28:00 AM
|
5 comments
![]()
